Park City Real Estate Market Update April 2020
Posted by Negar Chevre on Tuesday, May 12th, 2020 at 9:05am.
 The weather in Park City is getting warmer, spring is definitely here and with Summit County lifting the stay at home order on May 1st, our local businesses are starting the processes of re-opening, while conforming with the new health guidelines. As we prepare for the summer, our local community continues to take advantage of all the open space, enjoying the endless hiking and biking trails and outdoor activities our beautiful mountain town has to offer.
As for the Park City Real Estate market in what has been an uncertain time to say the least - rather than rely on gut feelings and assumptions based on anecdotal stories, we are of the school of thought that opinions are best formed based on verified and unbiased statistics and real numbers accumulated from actual market data.
The statistics over the last three weeks, assembled by the Park City Board of Realtors shows momentum in our market, one that we hope will continue as the Park City and Wasatch Back economies reopen. Listings have made a comeback as sellers gain confidence that realtors are able to safely show their properties, offers are being presented and accepted and although there has been much talk lately in real estate circles of possible bargain hunting with buyers seeking 15 to 20% discounts on properties across the nation, so far, the numbers in Park City tell a different tale. While the demand in certain areas of our market may have decreased, some neighborhoods and price points are seeing multiple offers. I represented buyers this week that successfully put a Silver Creek Estates property (11 acre equestrian listing with main house and barn listed for $1.495 million) under contract in a multiple offer situation; one of many properties in that price point where we have seen multiple offers in the past few weeks. Pended sales in the last two weeks have now surpassed 2019 weekly totals, inventory levels remain low and the Park City market statistics at least for the time being, shows relatively stable prices with average list/ask to sales price ratios holding steady between 94% - 95%.

After four weeks where the new listing count for this year was headed downward and two weeks where it was trailing last year by a widening gap, new listing in Week 14 jumped 33% over the week before and are headed on a trajectory to cross 2019. However, Weeks 15 and 16 showed more weakness as new listings dropped to 50% of same week last year. Week 17 shows a demonstrable upward turn and Week 18 continued that upward path in almost a straight line. This is a very positive sign that we may be finally encountering inventory declines seen elsewhere across the country.
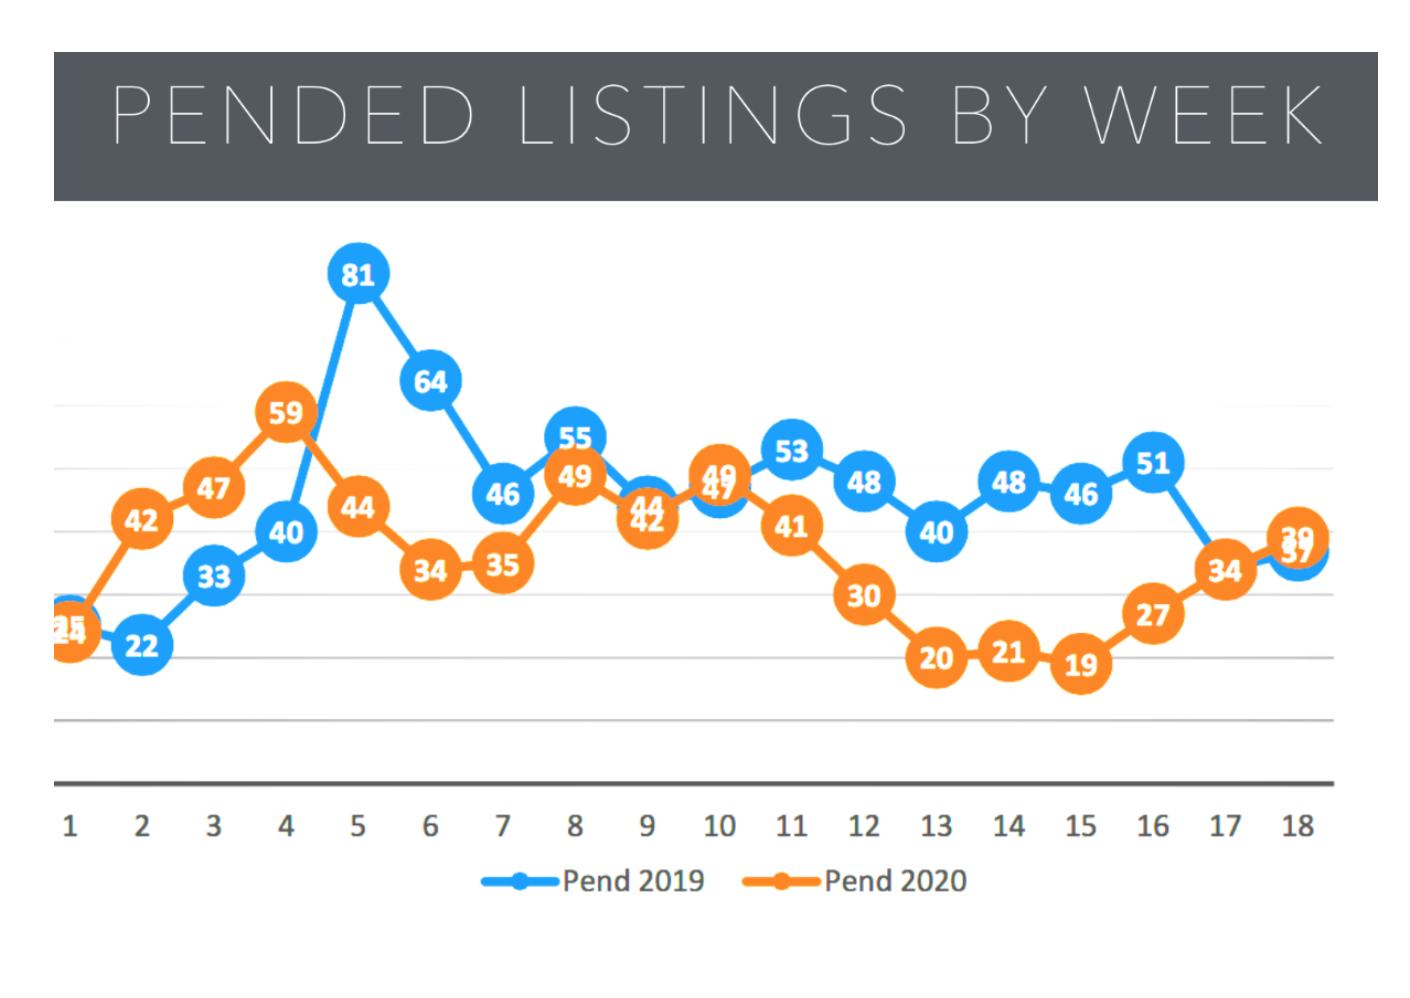
Perhaps the best leading indicator of market direction is the number of homes going under contract (Pending). Contracts written started downward after Week 10 which accounted for the drop in closings in weeks 15 thru 17. Weeks 13 to 15 look like the level bottom we anticipated and since then we see a strong rebound in Weeks 16-18 with Week 18’s 39 Pendings surpassing the same week last year, something we have not seen in the past two months.
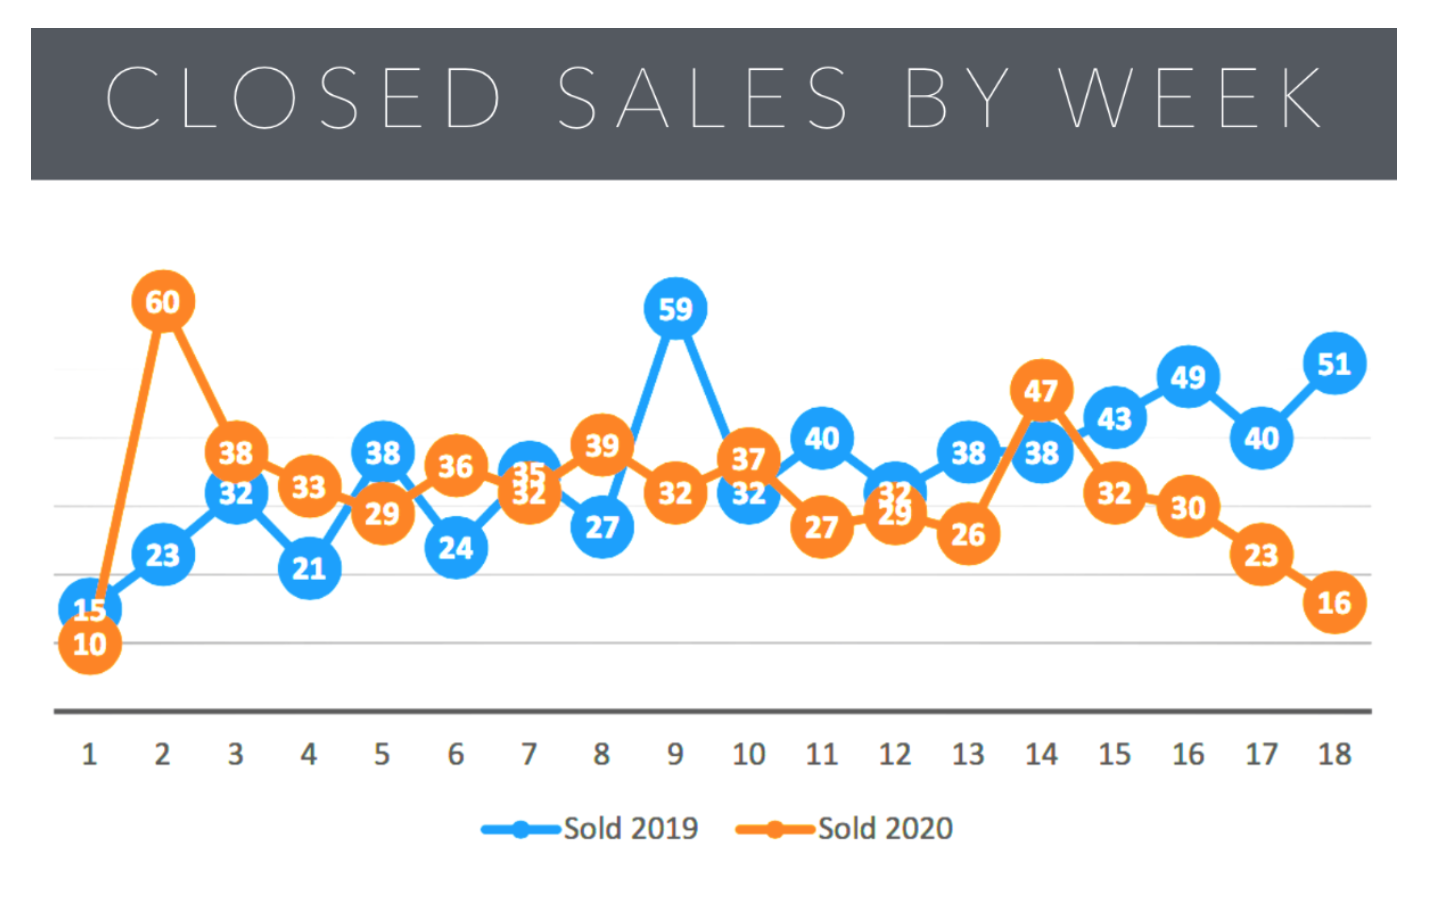
Closed listings during the period are relatively steady, seesawing over and under the comparable week last year. Week 13 was down, 14 was up, Week 15 was back down and Weeks 16-18 continued that downward trajectory. 16 closings in the last week are the lowest number since the first week of the year. However, it is important to note that closed transactions trail pended sales by 6 to 8 weeks as they work through the escrow process. We should therefore expect to see closings parallel pended sales from 6 weeks earlier which was when pended sales bottomed and started back toward recovery.
Fall through activity - (Listings posted as Pending when contracts are written but then fail to close and are put back on the Active market). Only five contracts fell out since our last report allowing April to finish with barely more than half March’s total. This slowing of the rate of contract failure is a strong indicator that the market is stabilizing. A good sign. Withdrawn (temporarily off the market) and Cancelled (listing contract terminated before expiration) both showed significant spikes in March compared to the year before. April reversed that trend, but the number is still high. Another data point: of the 136 Withdrawals since March 1, 12 of them have returned to Active status. This could be a sign that sellers are starting to return to the market, a sign we will watch closely in the future.
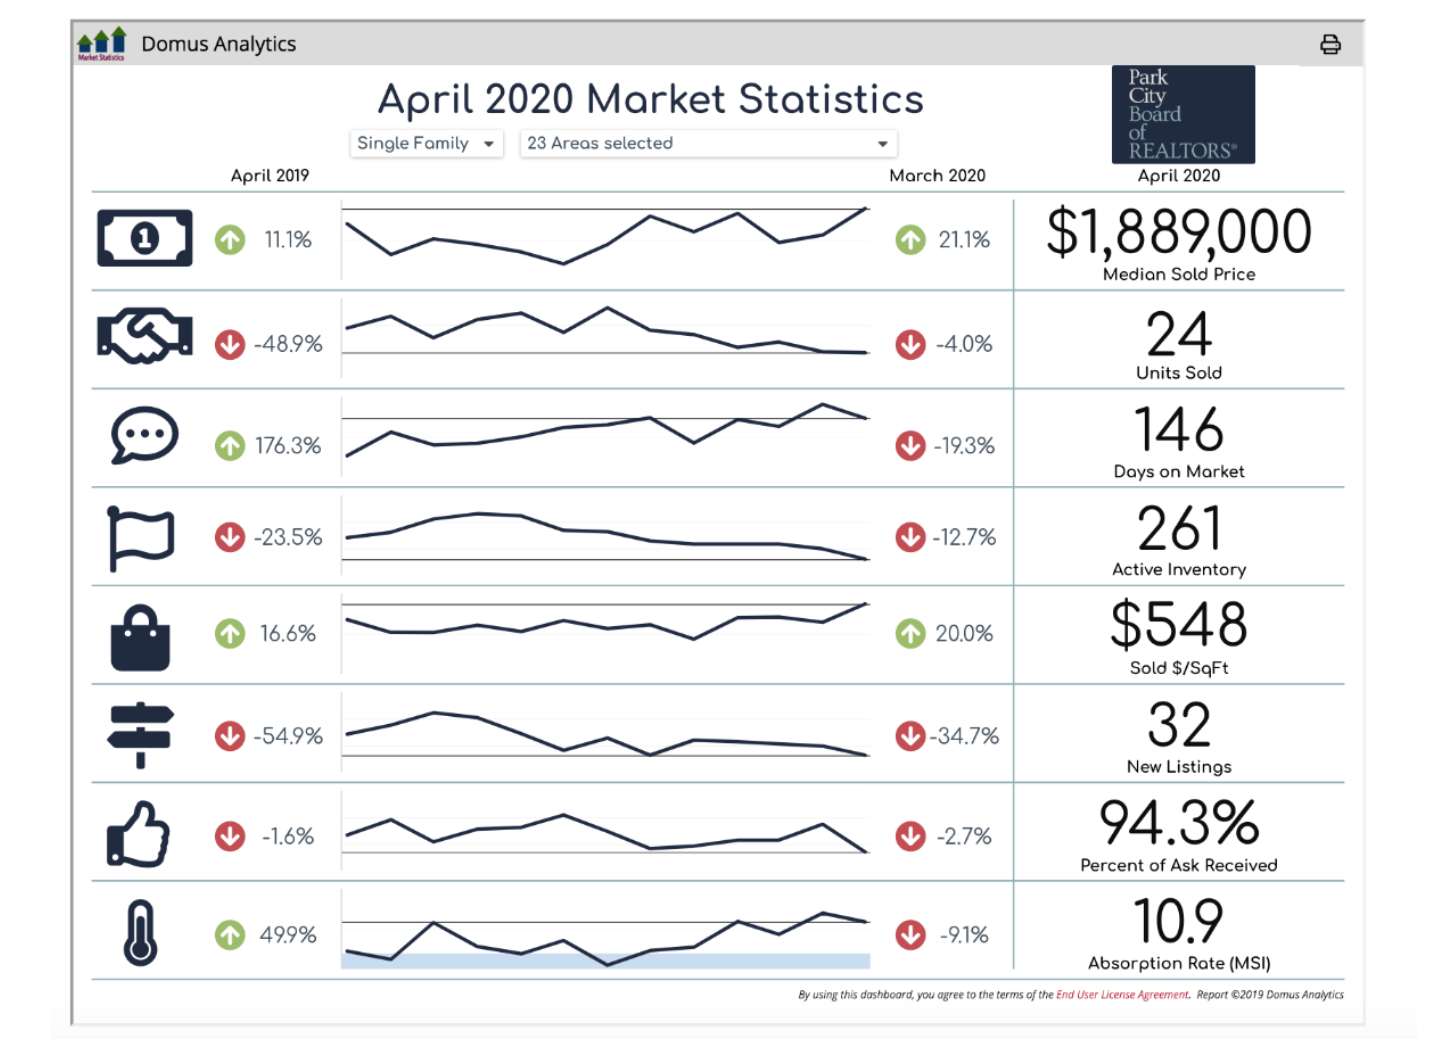
Overall for the month of April, the statistics for single family home sales in the Greater Park City Area leave room for optimism. Here are some key takeaways from the April 2020 numbers as it relates to Single Family Homes in the Greater Park City Market:
- Median prices for single family homes are up 21% compared to March of 2020 and up 11% compared to April last year
- Though the number of properties sold in March of 2020 is down by 4%, Single Family Homes are selling at a 94.3% of asking price down slightly by 2.7% in comparison to March and only 1.6% from April of last year.
- Though the Average Days on Market is significantly higher in relation to last year this time, it is down 19.3% in comparison to March of 2020
- Active inventory of Single Family Homes, is down 23.5% in comparison to last year in April and down 12.7% in comparison to March of 2020. Less inventory means a greater demand for homes that are available for sale and less properties to compete against for sellers. So if you are looking to sell your property, now is a good time to consider bringing it back on the market.
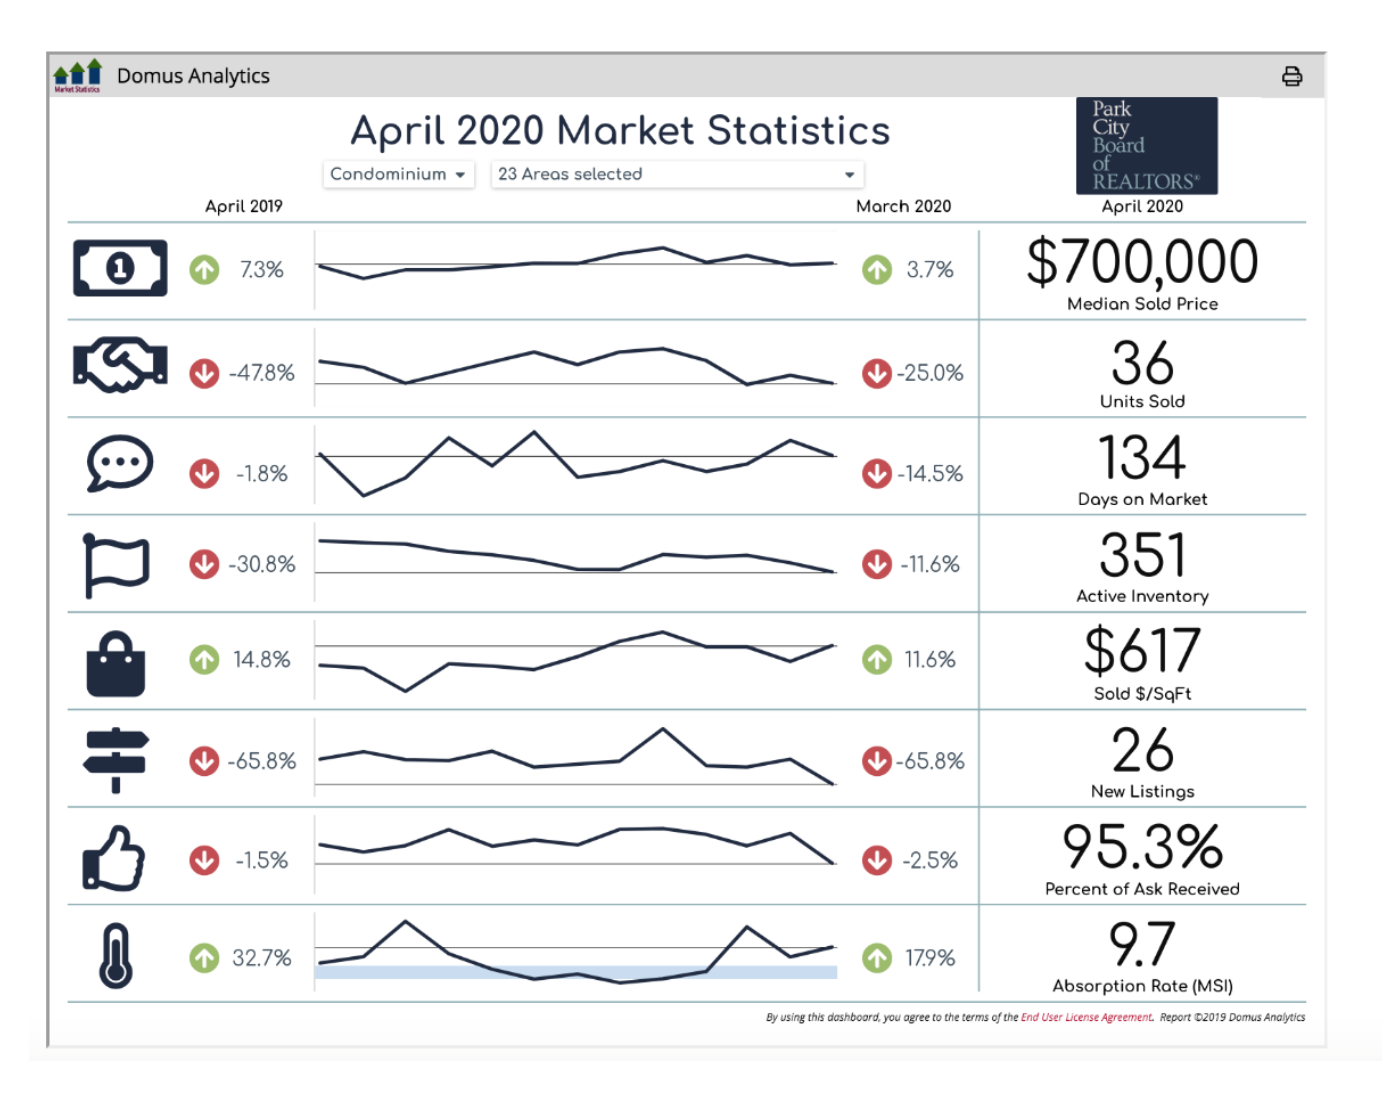
How did the Condominium and Townhouse Market fair in April of 2020? Here are a few takeaways:
- Median price for Condominiums and Town homes remains stable with a 3.7% increase in April of 2020 in comparison to March of the same year and a 7.3% increase in comparison to last year this time.
- Condominiums and Townhomes are selling at an average of 95.3% of the asking price, down only 2.5% in comparison to March of this year and only 1.5% lower than April of last year.
- The average Days on Market is down 14.5 in April in comparison to March and very close to levels this time last year.
- Inventory levels for condos and townhouses are down 11.6% in comparison to March and 30.8% lower than last year this time. Lower inventory levels explains the decrease in sales as buyers have a harder time finding properties that match their requirements. It also creates a greater demand for sellers who opt to keep their condos on the market.
We hope you find this May Newsletter informative and look forward to supporting you in your real estate buying and selling needs whenever the time is right for you!